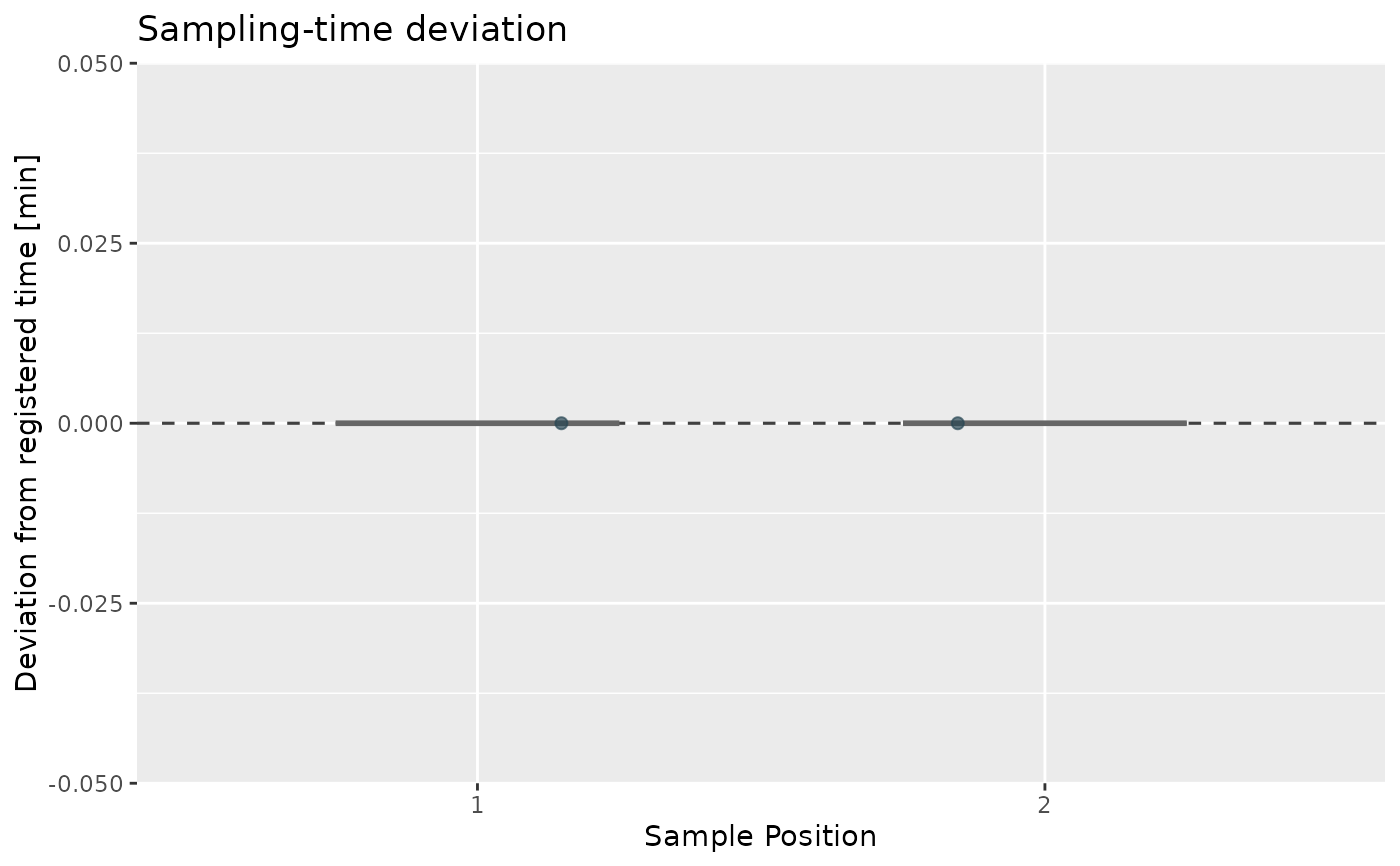
Negative values indicate early collection and positive values late collection. Boxes summarize each group while jittered points retain every recorded observation.
Examples
fixture <- system.file("extdata", "parity", "v1.0.0", package = "carwatch")
results <- read_study_results(file.path(fixture, "results.csv"))
plot_timing_deviation(results)