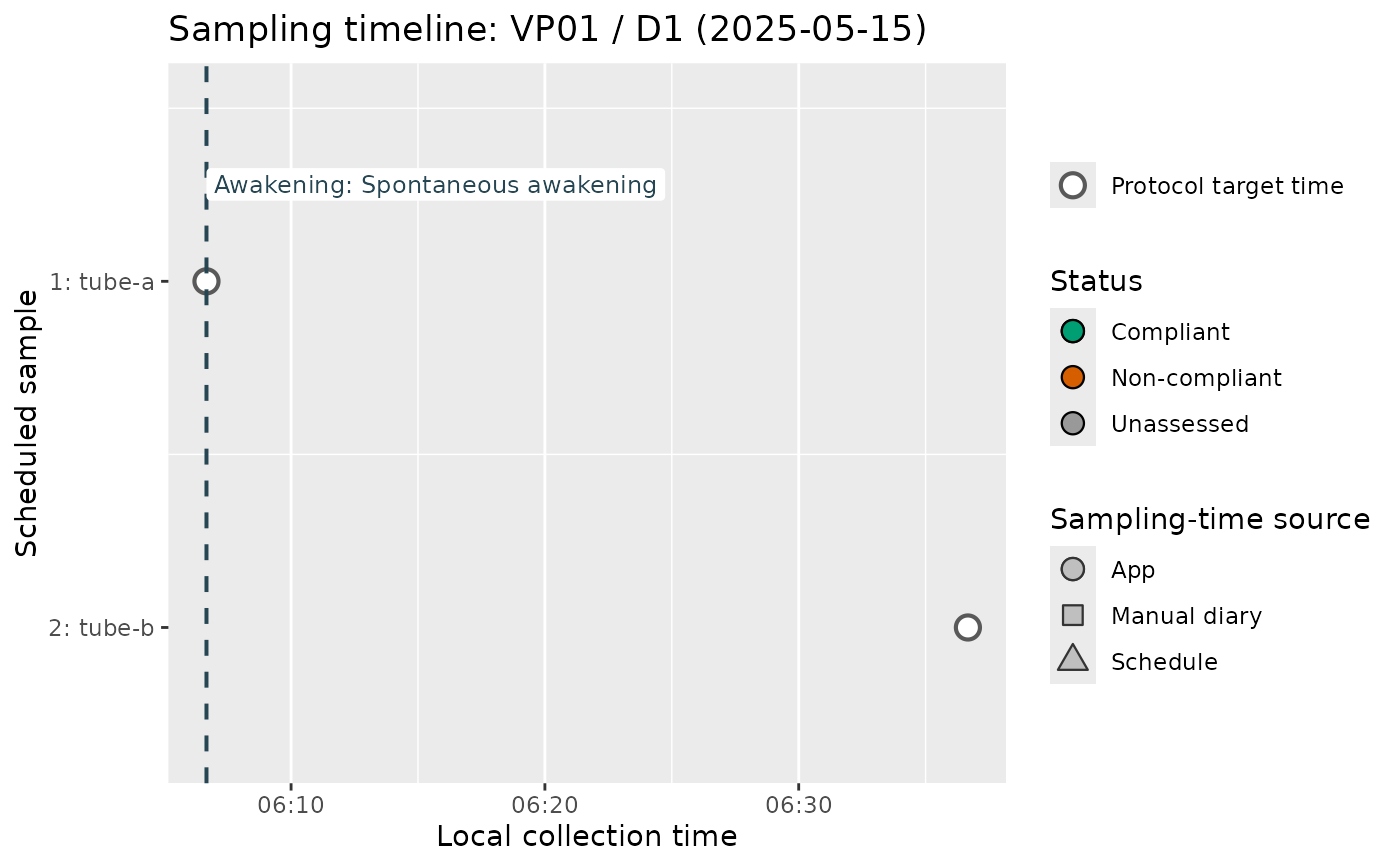
Actual sampling events are coloured by compliance and shaped by timestamp
provenance. When show_expected = TRUE, hollow grey circles show the static
protocol targets, hollow blue diamonds show targets updated from preceding
recorded relative samples, and arrows show the signed deviation from the
app-updated target. Missing relative scans break the adaptive target chain.
Missing events and scheduled/recorded sample mismatches remain visible.
Examples
fixture <- system.file("extdata", "parity", "v1.0.0", package = "carwatch")
results <- read_study_results(file.path(fixture, "results.csv"))
plot_sampling_timeline(results, participant = "VP01", day = "D1")