Plot cohort sampling compliance
Usage
plot_compliance_overview(
  data,
  by = "sample_position",
  view = c("proportion", "heatmap")
)Examples
fixture <- system.file("extdata", "parity", "v1.0.0", package = "carwatch")
results <- read_study_results(file.path(fixture, "results.csv"))
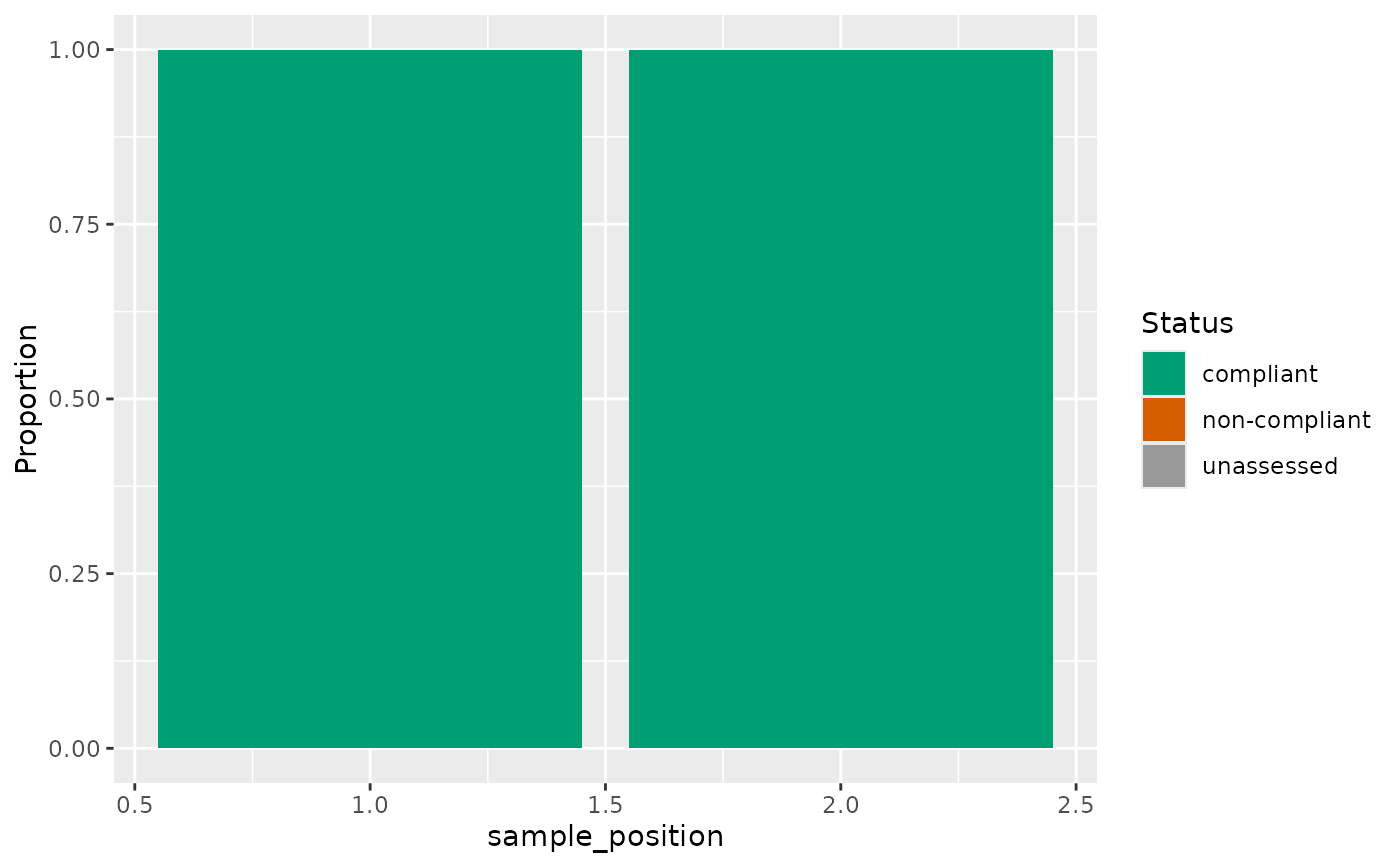
plot_compliance_overview(results)